Coding Your First Algorithm — Draw A Line
Here’s a list of my best web development tutorials.
Complete CSS flex tutorial on Hashnode.
Ultimate CSS grid tutorial on Hashnode.
Higher-order functions .map, .filter & .reduce on Hashnode.
Follow me @ Twitter, Instagram & fb to never miss premium articles.
A new project always starts with a problem-solving question.
How do you draw a line on a computer screen without canvas or libraries?
As someone new to coding you often hear about algorithms.
Creators of HTML Canvas, SVG, WebGL and other graphics libraries had to write code for drawing lines from scratch.
It’s time to draw the line between hearing about something and doing it! :)
In this tutorial I will show you the nuts and bolts of what it’s like to design an algorithm. I will take the Bresenham’s Line Drawing algorithm as an example.
Why Bresenham’s Line Drawing Algorithm?
I think it’s a perfect specimen to learn from for many reasons:
- It’s rewarding — you don’t just crunch numbers but also see visual results.
- It’s relatively simple as your first example to study algorithms from.
- It uses the Cartesian Coordinate System — the one used as the basis in many popular algorithms. It’s prerequisite to Machine Learning (which uses so called activation functions in AI, which are CCS-based math equations.)
- You can implement it in JavaScript (see the live demo here.)
Do you ever have a project you always lay off for later? You know - that one idea you wish you had coded but you can’t because you are currently in the middle of something more important?
Well, drawing a line in HTML without canvas was something on my mind for over a year. And I finally decided to make this tutorial on the subject!
By the way you can follow me on Twitter for more freemium tutorials.
Check out this line drawing demo live in action on a sample page I created.
The above is the result of the algorithm explained in this tutorial. A line is drawn between two points on a typical raster display. In this case, I used a simple HTML grid made up of DIV elements. It’s kind of slow, and not suitable for high-performance graphics rendering in real-time, but it clearly demonstrates the purpose of this algorithm!
How would something like this work? I created this demo screenshot to show the basic idea in action. Given any two end points — we can render a line on a raster display.
In this case, it’s represented by a simple HTML grid made out of DIV elements!
How Does It Work?
Algorithms are tricky beasts.
First, it’s best to visualize what it is you’re trying to accomplish.
Bresenham’s algorithm solves the problem of drawing lines in Quadrant 1:
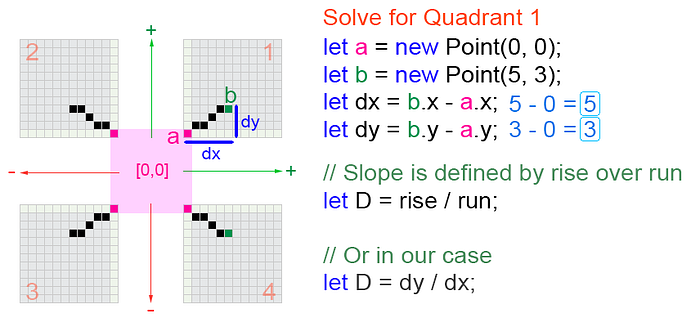
Drawing a line in any direction requires thinking in quadrants.
While the algorithm for Quadrant 1 is simple — implementation for all quadrants (and octants) is tricky. But only logistically. The rest of the cases are simple mirror images of the two octants in Quadrant 1.
This means that instead of reinventing the wheel all you have to do is swap some variables around or flip their sign here and there.
The problem is — how do we code that in JavaScript?
Why Draw Lines in HTML Without Canvas?
Many reasons!
To provide a clear explanation of how Bresenham’s drawing algorithm works.
Many Bresenham’s line drawing tutorials I came across only explained mathematical derivations. But they didn’t go into much detail about code for each octant or physically implementing the demo. It just felt like implementing something you don’t really understand.
It’s simple — some things are just fun. I mean, wouldn’t it be great to draw lines in HTML without using canvas or WebGL? In this line drawing tutorial I will write a JavaScript class that handles instantiation of a single HTML line. You can spawn as many as you like.
I come from a game development background. And in games you often deal with drawing lines. But beyond that, I always found the idea of drawing lines in HTML fascinating. Probably because I’ve never seen it done before.
Of course, raw HTML rendering speed will be an issue. And yes, further optimizations will be required to achieve meaningful performance. But the focus of this line drawing tutorial is primarily set on the line drawing algorithm explanation itself. You can always re-implement it in any other raster environment or graphics library.
Implementing Line Drawing Algorithm in JS
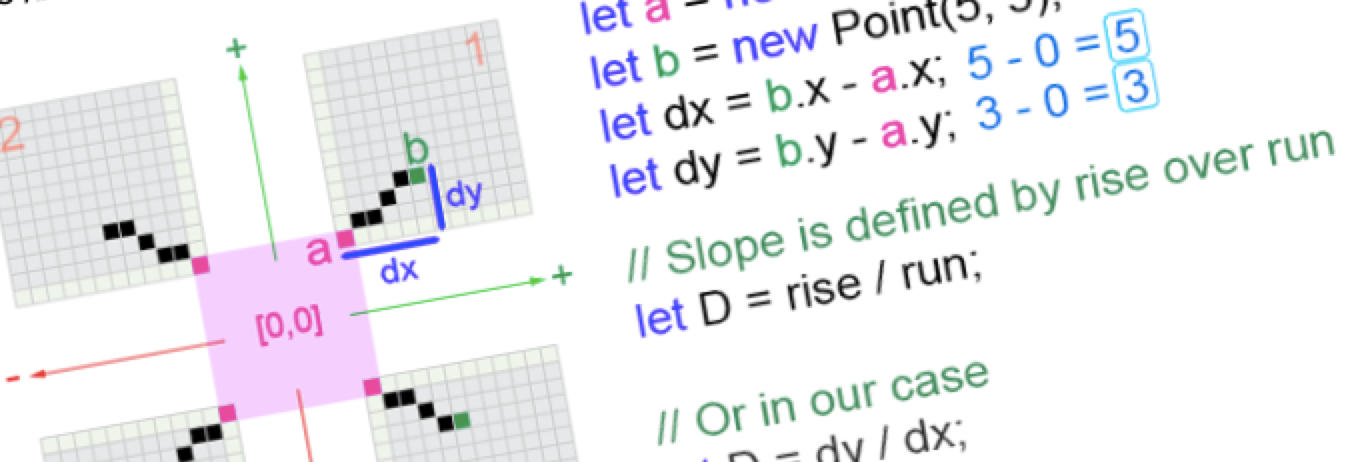
We take two deltas and calculate the slope of the line equation, based on two end points of the line.
The starting and ending points of the line are provided to the four parameters of the draw_line function ([x0, y0] and [x1, y1] respectively).
You can implement this in C, C++, Python, Java or any other language. In this tutorial, of course, we will use JavaScript.
After we get a good grasp on the algorithm visually, it’s time to start converting the logic into code.
Here is the pseudo code:
draw_line(x0, y0, x1, y1)  // Calculate "deltas" of the line (difference between two ending points)
  dx = x1 - x0
  dy = y1 - y0  // Calculate the line equation based on deltas
  D = (2 * dy) - dx
  y = y0  // Draw the line based on arguments provided
  for x from x0 to x1    // Draw pixel at this location
    pixel(x, y)    // Progress the line drawing algorithm parameters
    if D > 0
       y = y + 1
       D = D - 2*dx
    end if
    D = D + 2*dy
Converting it to JavaScript, we get the following:
let draw_line = (x0, y0, x1, y1) => {    // Calculate "deltas" of the line (difference between two ending points)
    let dx = x1 - x0;
    let dy = y1 - y0;    // Calculate the line equation based on deltas
    let D = (2 * dy) - dx;    let y = y0;    // Draw the line based on arguments provided
    for (let x = x0; x < x1; x++)
    {
        // Place pixel on the raster display
        pixel(x, y);        if (D >= 0)
        {
             y = y + 1;
             D = D - 2 * dx;
        }        D = D + 2 * dy;
    }
};
Note that all this is only for Quadrant 1.
Algorithm Logic Explanation:
First we calculate the difference between the line’s end points on both axes (dx and dy) which are usually referred to as the deltas — for each of the two dimensions, respectively.
Then we calculate the delta of the line as a whole (here stored in variable D) — you can think of it as the mathematical equation for drawing a line. Or in other words the line slope equation.
Before iterating through each span of the line, let’s reset the y-axis counter (that we will walk using a for-loop, as the line is being drawn) by setting it to the initial position on the line. Here y0 refers to the Y coordinate of the first point on the line.
Finally, draw the line one “pixel” at a time, in pseudo code shown as pixel(x, y) function. Once the pixel is rendered, we can adjust the current pixel position using the delta steps we calculated.
Every time the delta counter exceeds 0 we step down to the next pixel on the Y-axis and adjust the D variable again but in the opposite dimension, which ends up in progressively drawing the line across both dimensions until we reach the line’s end.
But that’s not everything. In addition, depending on axis-dominance, the for-loop must be modified to travel in that direction. To complete the algorithm, we must also adjust parameters based on what octant (out of eight) we are in. This is explained in detail in the following section.
Drawing In All 4 Quadrants / 8 Octants
The barebones Bresenham’s line algorithm above is designed to draw a line only in one quadrant (Quadrant 1) of the Cartesian coordinate system. But we need to cover all directions. After all, a random line can be plotted from any point on the raster screen to any other point.
This means that in addition to the pseudo code above, we need to take care of two other things:
- Quadrant-Aware Algorithm. The algorithm must adjust iterator parameters, for each of the four quadrants. We can swap line endpoints to make sure that we always draw the line from left to right, and split the algorithm in two main parts (line is pointing either up or down from the starting point.) Or we can branch out in four different cases, for each quadrant respectively, and just swap x-axis and y-axis iterators to accommodate for line direction.
- Axis-Dominance. But even in each of the four quadrants, the line will either be x-axis or y-axis dominant. This means there are actually not four but eight different cases. One for each of the eight octants. Luckily, the algorithm stays exactly the same, all we need to do is switch the iterators and branch out a few times.
That’s a lot of branching out. But the algorithm presented in the following example will take care of all possible cases.
The Complete Bresenham’s Algorithm In JavaScript
Okay — all of this sounds great in theory — and we already covered the pseudo code and JavaScript version — but only for one quadrant! Let’s take a look at the whole enchilada.
let draw_line = (x1, y1, x2, y2) => {    // Iterators, counters required by algorithm
    let x, y, dx, dy, dx1, dy1, px, py, xe, ye, i;    // Calculate line deltas
    dx = x2 - x1;
    dy = y2 - y1;    // Create a positive copy of deltas (makes iterating easier)
    dx1 = Math.abs(dx);
    dy1 = Math.abs(dy);    // Calculate error intervals for both axis
    px = 2 * dy1 - dx1;
    py = 2 * dx1 - dy1;    // The line is X-axis dominant
    if (dy1 <= dx1) {        // Line is drawn left to right
        if (dx >= 0) {
            x = x1; y = y1; xe = x2;
        } else { // Line is drawn right to left (swap ends)
            x = x2; y = y2; xe = x1;
        }        pixel(x, y); // Draw first pixel        // Rasterize the line
        for (i = 0; x < xe; i++) {
            x = x + 1;            // Deal with octants...
            if (px < 0) {
                px = px + 2 * dy1;
            } else {
                if ((dx < 0 && dy < 0) || (dx > 0 && dy > 0)) {
                    y = y + 1;
                } else {
                    y = y - 1;
                }
                px = px + 2 * (dy1 - dx1);
            }            // Draw pixel from line span at
            // currently rasterized position
            pixel(x, y);
        }    } else { // The line is Y-axis dominant        // Line is drawn bottom to top
        if (dy >= 0) {
            x = x1; y = y1; ye = y2;
        } else { // Line is drawn top to bottom
            x = x2; y = y2; ye = y1;
        }        pixel(x, y); // Draw first pixel        // Rasterize the line
        for (i = 0; y < ye; i++) {
            y = y + 1;            // Deal with octants...
            if (py <= 0) {
                py = py + 2 * dx1;
            } else {
                if ((dx < 0 && dy<0) || (dx > 0 && dy > 0)) {
                    x = x + 1;
                } else {
                    x = x - 1;
                }
                py = py + 2 * (dx1 - dy1);
            }            // Draw pixel from line span at
            // currently rasterized position
            pixel(x, y);
        }
    }
 }
This is just one way of writing the Bresenham’s line drawing algorithm. You can juggle around parameters and improvise on branching out. But the basic idea is there.
The main if-statement branches out between two potential axis-dominance cases.
The code is octant-aware — within the two if-statement scopes you will also see that the code basically mirrors itself between the X and Y axis (tracked by variables px and py) but the algorithm logic is pretty much identical otherwise.
pixel(x, y)
Remember, we are not using canvas or any other graphics library when writing our own graphics algorithms.
This means the actual medium in which you choose to draw the data depends entirely on you. In this demo I used a basic DIV grid.
This function pixel(x, y) is how you choose to implement the drawing of the line based on what type of raster display you will use.
It basically puts a “pixel” at X and Y location on the “screen” / render output.
Final Words
Often, people ask me how to improve their coding skills. I usually suggest choosing a project slightly above the range of your current ability. If you make sure to finish it, this experience will help you advance your coding skills. For me, this was that type of project.
Still available — Grab a copy of CSS Visual Dictionary here in PDF format.